Forecasting is hard but fun. From casual bets amongst friends to political pundits predicting who is ahead on polls, we are surrounded by forecasts and predictions. We love to assign a high value to people’s ability to make accurate forecasts. It is considered a sign of intelligence and awareness and ultimate bragging rights. Someone recently gifted me Super-forecasting and it challenged quite a few notions about predictions. Super-forecasting is based on the learnings of a group of forecasters, who competed in a forecasting contest organised by the IARPA (defence intelligence community) in 2011. The Iraq war which was fought on the premise that Saddam had weapons of mass destruction that eventually turned out to be grossly incorrect, prompted this initiative. The Intelligence Community (IC) wanted to learn if and how such intelligence disasters could be avoided in the future.
The Good Judgement Project, the group that won the competition by some margin, comprised of non-experts. They were a motley crew of people from varying fields like engineers, theoretical physics, teachers, mechanics, etc and they were asked to make predictions about geo political and military events. These people were not political experts, had no access to classified data and were certainly not people of privilege or power. They were people like you and I, who employed different strategies and thinking models to come up with mind bogglingly accurate predictions. This book is a culmination of the ideas employed by the GJP.
##### Which forecasts are useful. The Brier score.
My favourite takeaway from this book was getting introduced to the [Brier score](https://en.wikipedia.org/wiki/Brier_score). The Brier score helps you understand how accurate someone’s prediction is. The perfect Brier score is 0 and the lower it is, the better. A hedged 50-50 call scores 0.5 (something that is as likely to be wrong, as right). A completely incorrect prediction (opposite of what happens) scores 2.0.
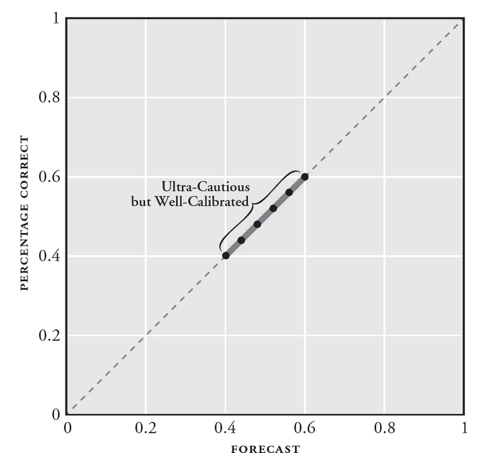
A curve is drawn for percentage of times one is accurate vs the actual forecast. Let’s take the example of a meteorologist to understand this. For her to be accurate, it has to rain 30% of the time, whenever it is claimed that there is 30% chance of rain. This is called calibration and perfect calibration is a straight line as shown in the curve above. If you actual prediction curve lies above it, it is a mark of being under confident (it rains 50% of the time when you say there is 20% chance of rains) and below it, means you are overconfident (it rains 20% of the time whenever you say there’s 50% chance of rains).
Another important thing to remember is that the edges of the curve are more important and relevant. When a forecaster says there’s 40% chance of something, that isn’t exactly useful as there’s nearly 50-50 chances of something happening. It’s a cowardly position to hold. When someone says there’s 5% chance of something or 85% chance of something, that’s when they are really making bold predictions and those are the predictions that when you get right, get you somewhere meaningful.
##### Why being precise is so important
The importance of speaking in numbers is quite crucial in ensuring everyone knows what is on the line. This is kind of inline with cowardly-bold metrics in the previous section. We must avoid using loose terms like “fairly regularly” or “significantly expected“. The table below provides a good reference point.
| Certainty | Area of possibility |
|---|---|
| 100% | Certain |
| 93% (give or take about 6%) | Almost certain |
| 75% (give or take about 12%) | Probable |
| 50% (give or take about 10%) | Chances about even |
| 30% (give or take about 10%) | Probably not |
| 7% (give or take about 5%) | Almost certainly not |
| 0% | Impossible |
In fact if possible, we must speak in probabilities with rationale behind them. The section on fermi-izing a problem will talk about it in more detail.
##### Active open-minded thinking
Jonathan Baron, a psychologist, coined the term Active open-minded thinking. AOT is a frame of mind in which one is actively seeking disagreeing views. When one practices AOT, they consider beliefs to be nothing more than hypotheses that need to be tested. Baron’s test for AOT asks whether you agree or disagree with statements like
*Changing your opinion is a sign of weakness*
*It is more useful to pay attention to those who disagree with you than those who agree with you*
*Intuition is the best guide in decision making*
*People should take into consideration evidence that goes against their beliefs*
If you score highly on the Baron’s test, you are likely good at shielding yourself against the confirmation bias that so heavily weighs on our decisions. Good forecasters change their views regularly. When new evidence comes to light, they are quick to update their predictions.
##### Fermi-izing a problem
Enrico Fermi is said to have come up with a brainteaser for his students. He asked how many piano tuners are there in Chicago. The answer isn’t as important as the underlying principles used by someone to come up with an answer. The way to actually make an intelligent guess here is to break down the problem into its constituent problems (fermi-ize the problem), answering which, will help you answer the overarching problem. For example, here’s how the author of the book looks at guessing how many piano tuners are there in Chicago.
1. How many pianos are there in Chicago.
2. How often does a piano need to be tuned in a year
3. How many hours does it take for a piano tuner to tune a piano
4. How many hours per year does a piano tuner work
Answering these questions can help you get to a half decent prediction. If there are x pianos and they need y tunings per year and each tuning takes z hours, then there need to be xyz hours of piano tunings in a year in Chicago. Assuming piano tuners work as much as any standard American worker, then this number can be simply 40 hours per week x 50 weeks minus 20% travel/vacation time to come up with 1600 hours. The final guess can be xyz/1600.
Let’s try and apply the same to the questions 1, 2 and 3. To answer 1, we need to know how many people are there in Chicago, what percentage of people would own a piano, how many institutions have pianos. A healthy guess based on these sub-questions is 50k. To answer 2, we need to make a black box guess (*something that sounds right without overthinking*). Say 1 tunings per year? This one is a pure guess. Finally, 3 can be another black box guess, say 2 hours. Assembling it all together, we get 63 piano tuners. The Chicago yellow pages, lists 83 piano tuners so that’s pretty close.
##### Synthesis of outside view and inside view
We make predictions on the basis of our tip-of-the-nose perspectives. Simple pieces of evidence that should ideally not be considered to make judgements often sway our views. Daniel Kahneman talks about this at length in Thinking fast and slow. We are focussed on the inside views. It’s a classic case of employing the [System 1](https://infermuse.com/lessons-from-thinking-fast-slow-part-1/) thinking. While it is important to build a judgement while considering case specific information, it is even more important to find out *what usually happens*. A synthesis of these two approaches is what leads to more accurate predictions. We must always start with the base rate and then append the specific information in front of us to see if it moves our prediction up or down.
##### Taleb’s Fat tail distribution of wealth
We are used to applying the bell shaped curve to everything and to some extent that works. There are however many scenarios where it is not the right model. Wealth, for instance, follows, what Nicholas Nassim Taleb calls the fat tail model. 95% of American households have an annual income between $10k to $100k. There are over 500 individuals with over a billion dollars in income. What we see in effect is a curve that has a fatter tail on the right.
Taleb posits that historical probabilities, the various events that could unfold, follow the fat tail model. If someone had asked after world war 1, if we will have a global event that will kill over 60m people in the next 30 years, what chance would have people assigned to it? Surely, one in a million. Real life is a lot more unpredictable than we understand and that makes forecasting a lot harder than we think.
- - - - - -
I run a startup called [Harmonize](http://www.harmonizehq.com/). We are hiring and if you’re looking for an exciting startup journey, please write to jobs@harmonizehq.com. Apart from this blog, [I tweet ](https://twitter.com/dillisingh)about startup life and practical wisdom in books.
 The Good Judgement Project, the group that won the competition by some margin, comprised of non-experts. They were a motley crew of people from varying fields like engineers, theoretical physics, teachers, mechanics, etc and they were asked to make predictions about geo political and military events. These people were not political experts, had no access to classified data and were certainly not people of privilege or power. They were people like you and I, who employed different strategies and thinking models to come up with mind bogglingly accurate predictions. This book is a culmination of the ideas employed by the GJP.
##### Which forecasts are useful. The Brier score.
My favourite takeaway from this book was getting introduced to the [Brier score](https://en.wikipedia.org/wiki/Brier_score). The Brier score helps you understand how accurate someone’s prediction is. The perfect Brier score is 0 and the lower it is, the better. A hedged 50-50 call scores 0.5 (something that is as likely to be wrong, as right). A completely incorrect prediction (opposite of what happens) scores 2.0.
The Good Judgement Project, the group that won the competition by some margin, comprised of non-experts. They were a motley crew of people from varying fields like engineers, theoretical physics, teachers, mechanics, etc and they were asked to make predictions about geo political and military events. These people were not political experts, had no access to classified data and were certainly not people of privilege or power. They were people like you and I, who employed different strategies and thinking models to come up with mind bogglingly accurate predictions. This book is a culmination of the ideas employed by the GJP.
##### Which forecasts are useful. The Brier score.
My favourite takeaway from this book was getting introduced to the [Brier score](https://en.wikipedia.org/wiki/Brier_score). The Brier score helps you understand how accurate someone’s prediction is. The perfect Brier score is 0 and the lower it is, the better. A hedged 50-50 call scores 0.5 (something that is as likely to be wrong, as right). A completely incorrect prediction (opposite of what happens) scores 2.0.
 A curve is drawn for percentage of times one is accurate vs the actual forecast. Let’s take the example of a meteorologist to understand this. For her to be accurate, it has to rain 30% of the time, whenever it is claimed that there is 30% chance of rain. This is called calibration and perfect calibration is a straight line as shown in the curve above. If you actual prediction curve lies above it, it is a mark of being under confident (it rains 50% of the time when you say there is 20% chance of rains) and below it, means you are overconfident (it rains 20% of the time whenever you say there’s 50% chance of rains).
Another important thing to remember is that the edges of the curve are more important and relevant. When a forecaster says there’s 40% chance of something, that isn’t exactly useful as there’s nearly 50-50 chances of something happening. It’s a cowardly position to hold. When someone says there’s 5% chance of something or 85% chance of something, that’s when they are really making bold predictions and those are the predictions that when you get right, get you somewhere meaningful.
##### Why being precise is so important
The importance of speaking in numbers is quite crucial in ensuring everyone knows what is on the line. This is kind of inline with cowardly-bold metrics in the previous section. We must avoid using loose terms like “fairly regularly” or “significantly expected“. The table below provides a good reference point.
A curve is drawn for percentage of times one is accurate vs the actual forecast. Let’s take the example of a meteorologist to understand this. For her to be accurate, it has to rain 30% of the time, whenever it is claimed that there is 30% chance of rain. This is called calibration and perfect calibration is a straight line as shown in the curve above. If you actual prediction curve lies above it, it is a mark of being under confident (it rains 50% of the time when you say there is 20% chance of rains) and below it, means you are overconfident (it rains 20% of the time whenever you say there’s 50% chance of rains).
Another important thing to remember is that the edges of the curve are more important and relevant. When a forecaster says there’s 40% chance of something, that isn’t exactly useful as there’s nearly 50-50 chances of something happening. It’s a cowardly position to hold. When someone says there’s 5% chance of something or 85% chance of something, that’s when they are really making bold predictions and those are the predictions that when you get right, get you somewhere meaningful.
##### Why being precise is so important
The importance of speaking in numbers is quite crucial in ensuring everyone knows what is on the line. This is kind of inline with cowardly-bold metrics in the previous section. We must avoid using loose terms like “fairly regularly” or “significantly expected“. The table below provides a good reference point.